Michigan’s Graduate Student Instructors (GSIs) receive student evaluations for every class they teach. The undergrads are invited to rate their GSIs using Likert Scales (aside: Likert had a degree in economics from the University of Michigan). Students see something like this:

Overall, the instructor was an excellent teacher
Strongly Disgree Disagree Neutral Agree Strongly Agree

The Registrar compiles this data, encoding “Strongly Disagree” as 1, “Strongly Agree” as 5, etc. They then provide GSIs with what is called their “Median score”, which is actually a slightly complicated interpolated form of the median.

The application of medians to discrete values was perplexing, so I asked the Office of the Registrar to provide me with the exact formula they use. They did so, and I reproduce it here in case any GSI in the future ever wonders as I once did. (I checked: the Registrar has no objection to this being made public knowledge.)

Their formula, which requires some lingo that is explained below, is:

\(\text{Median } = \text{Lower Real Limit } + \frac{0.5N – a}{b}\)

Calculate the range the median must lie in, e.g. somewhere between 2 and 3. Let’s call this range “the interval”. The Lower Real Limit is the midway point of the interval, i.e. 2.5.

The total number of observations (in the whole sample) is denoted \(N\). Denote as \(a\) the number of responses below the Lower Real Limit. In this example, \(a\) would be equal to the numbers of 1s and 2s.

Recall that our interval is the range between 2 and 3. The upper-limit of this is 3. Finally, denote as \(b\) the number of observations that choose the upper-limit of this interval, i.e. the number of people that chose 3.

Now for an example, suppose you have the following scores:

Score 1 2 3 4 5
Frequency 2 1 8 14 7

By inspection, the median cannot be greater than 4 and cannot be lower than 3. Therefore our interval is 3-4, with a Lower Real Limit of 3.5. There are 32 responses, so \(N=32\). Eleven people chose a score below the Lower Real Limit, so \(a=11\). Fourteen people chose the upper-limit of the interval, so \(b=14\). Plugging this into our equation above:

\(\text{Median } = 3.5 + \frac{0.5(32) – 11}{14} = 3.86\).
//

While watching football this morning, I also kept an eye on the betting odds. As soon one team scored, the odds changed.

Instead of introducing the efficient market hypothesis to students as a theory about stocks and bonds, we should perhaps start by drawing parallels to sports-betting. It is hard to consistently make money betting on Premier League results. It’s not impossible, but it takes a lot of skill and/or luck to pull it off.

The same logic applies to beating the general rate of return in a market. Financial markets tend to adjust prices so that there are no obvious bargains. This is not a claim that sporting events never throw up shock victories, nor does it imply that markets never crash. If anything, it suggests that predicting a stock market crash is about as difficult as predicting a shock sporting victory.

Like comparative advantage, it’s hard for undergrads to grasp this idea. I have found that the sporting analogy works well as a stepping stone.

(While on the topic of the EMH: there’s a fun contrast between the predicament of Cassandra, who could perfectly predict the future but nobody would believe her, and the EMH. The more people believe in EMH, the less likely they are to actively search for arbitrage opportunities. This will tend to leave market-beating returns uncollected, nullifying the EMH. The converse also holds. In this respect, EMH is a self-defeating prophecy.)

//

I typeset the euro symbol (€) regularly and I’ve always thought the version produced in LaTeX sticks out a bit like a sore thumb. (I re-assure myself that noticing these things is evidence that I adequately proof-read my prose.) The code below makes a new command \yuro that (in my opinion) fits in better with the surrounding text.

\documentclass[12pt]{article}
\usepackage{eurosym}
\usepackage{graphicx}
\newcommand{\yuro}{\scalebox{0.95}{\euro}}
\begin{document}
This is the size with the \euro 1,000 original configuration.

This is the size with the \yuro 1,000 newer configuration.
\end{document}

The code shrinks the size of the symbol to make it fit better with other characters. Similarities to the status of the eurozone are unintentional.

//
I have generated an easy-to-read PDF of William Petty's Taxes and Contributions. You can download it here. Hard copies of the book, comprising poor photocopies of older editions, make difficult work on the eyes. This edition is typeset as a modern document. I did write a script to generate it though, so it's likely that there are some errors in there. Please let me know if you find any. Due credit to the nice people from McMaster University who transcribed the plain-text copy.
//
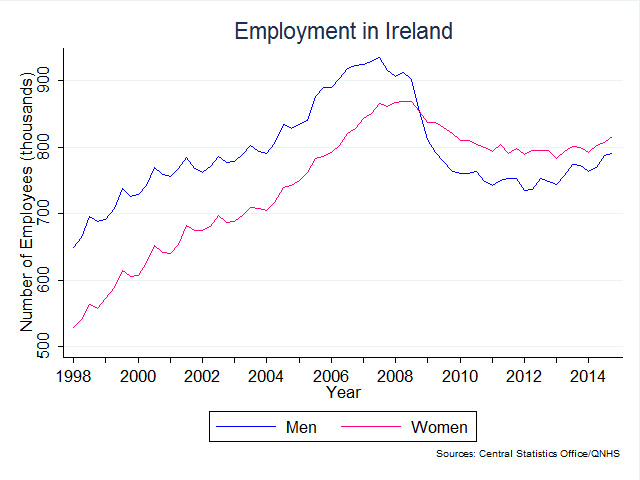
Most employees in Ireland are women. This fact does not imply that most workers are women, because men have a higher rate of self-employment. Nonetheless, most employees in Ireland are women. Note that the male and female paths pre- and post-2008 are almost parallel, but there was a huge shift in the composition of the labour force in 2008-2009.

(Title of the post refers to this book.)

//
"Ireland is a place which must have so great an Army kept up in it, as may make the Irish desist from doing themselves or the English harm by their future Rebellions. And this great Army must occasion great and heavy Leavies upon a poor people and wasted Countrey; it is therefore not amiss that Ireland should understand the nature and measure of Taxes and Contributions." -- William Petty (1662), A Treatise of Taxes & Contributions
//
"Although we should not be satisfied with any theory that fails to explain a lot with a little, we need not of course expect any one theory to explain everything, or even the most important thing. Absolutely nothing in all of epistemology suggests that valid explanations should be monocausal. An explanation may be entirely valid, yet explain only a part (and even a small part) of the variation at issue. [...] Since no monocausal explanation is offered, one well-known test of validity is not applicable. It is often said in methodological discussions that every meaningful scientific theory must specify one or more possible events or observations, or experimental results, which would, if they occurred, refute the theory. This rule has no applicability to multicausal conceptions unless a perfect experiment is performed, or one so nearly perfect that we could be certain that it was the error in the theory rather than the flaw in the experiment that accounted for the result. In view of the limited possibilities for experiments in economics and other social sciences, the impossibility of controlled experiments on historical events, and the extreme improbability that nature or history will on its own provide anything resembling a perfect natural experiment, a search for a single decisive refutation is futile. I am told by some philosophers of science that even in the physical and natural sciences the rejection of theories usually occurs not because of a single negative experiment, but more often from a series of anomalous observations combined with the emergence of a better alternative theory. What we should demand of a theory or hypothesis, then, is that it be clear about what observations would increase the probability that it was false and what observations would tend to increase the probability that there was some truth in it." -- Mancur Olson (1982) - writing before the profession's focus on quasi-experimental empirical estimates - in "The Rise and Decline of Nations".
//

Economists often denote a Lagrangian maximization problem with a scripted L. Unless you exert a little bit of effort, this looks poorly when produced by LaTeX. The code below allows you to easily typeset the symbol in a larger font-size.

The code creates four new commands: \lagrange1, \lagrange2, \lagrange3, and \lagrange4. They produce the “Lagrangian L” with increasing size.

\documentclass{article}

\usepackage{relsize}
\usepackage{mathrsfs}
\usepackage{xstring}

\newcommand{\lagrange}[1]{\IfEqCase{#1}{{1}{\mathscr{L}}{2}{\mathlarger{\mathscr{L}}}{3}{\mathlarger{\mathlarger{\mathscr{L}}}}{4}{\mathlarger{\mathlarger{\mathlarger{\mathscr{L}}}}}}}

\begin{document}
$$ \lagrange1 $$
$$ \lagrange2 $$
$$ \lagrange3 $$
$$ \lagrange4 $$
\end{document}


//
"I would add one word for any student beginning economic study who may be discouraged by the severity of the effort which the study, as he will find it exemplified here, seems to require of him. The complicated analyses which economists endeavour to carry through are not mere gymnastic. They are instruments for the bettering of human life. The misery and squalor that surround us, the injurious luxury of some wealthy families, the terrible uncertainty overshadowing many families of the poor---these are evils too plain to be ignored. By the knowledge that our science seeks it is possible that they may be restrained. Out of the darkness light! To search for it is the task, to find it perhaps the prize, which the 'dismal science of Political Economy' offers to those who face its discipline." - Arthur Pigou, November 1928
//
Scroll to Top