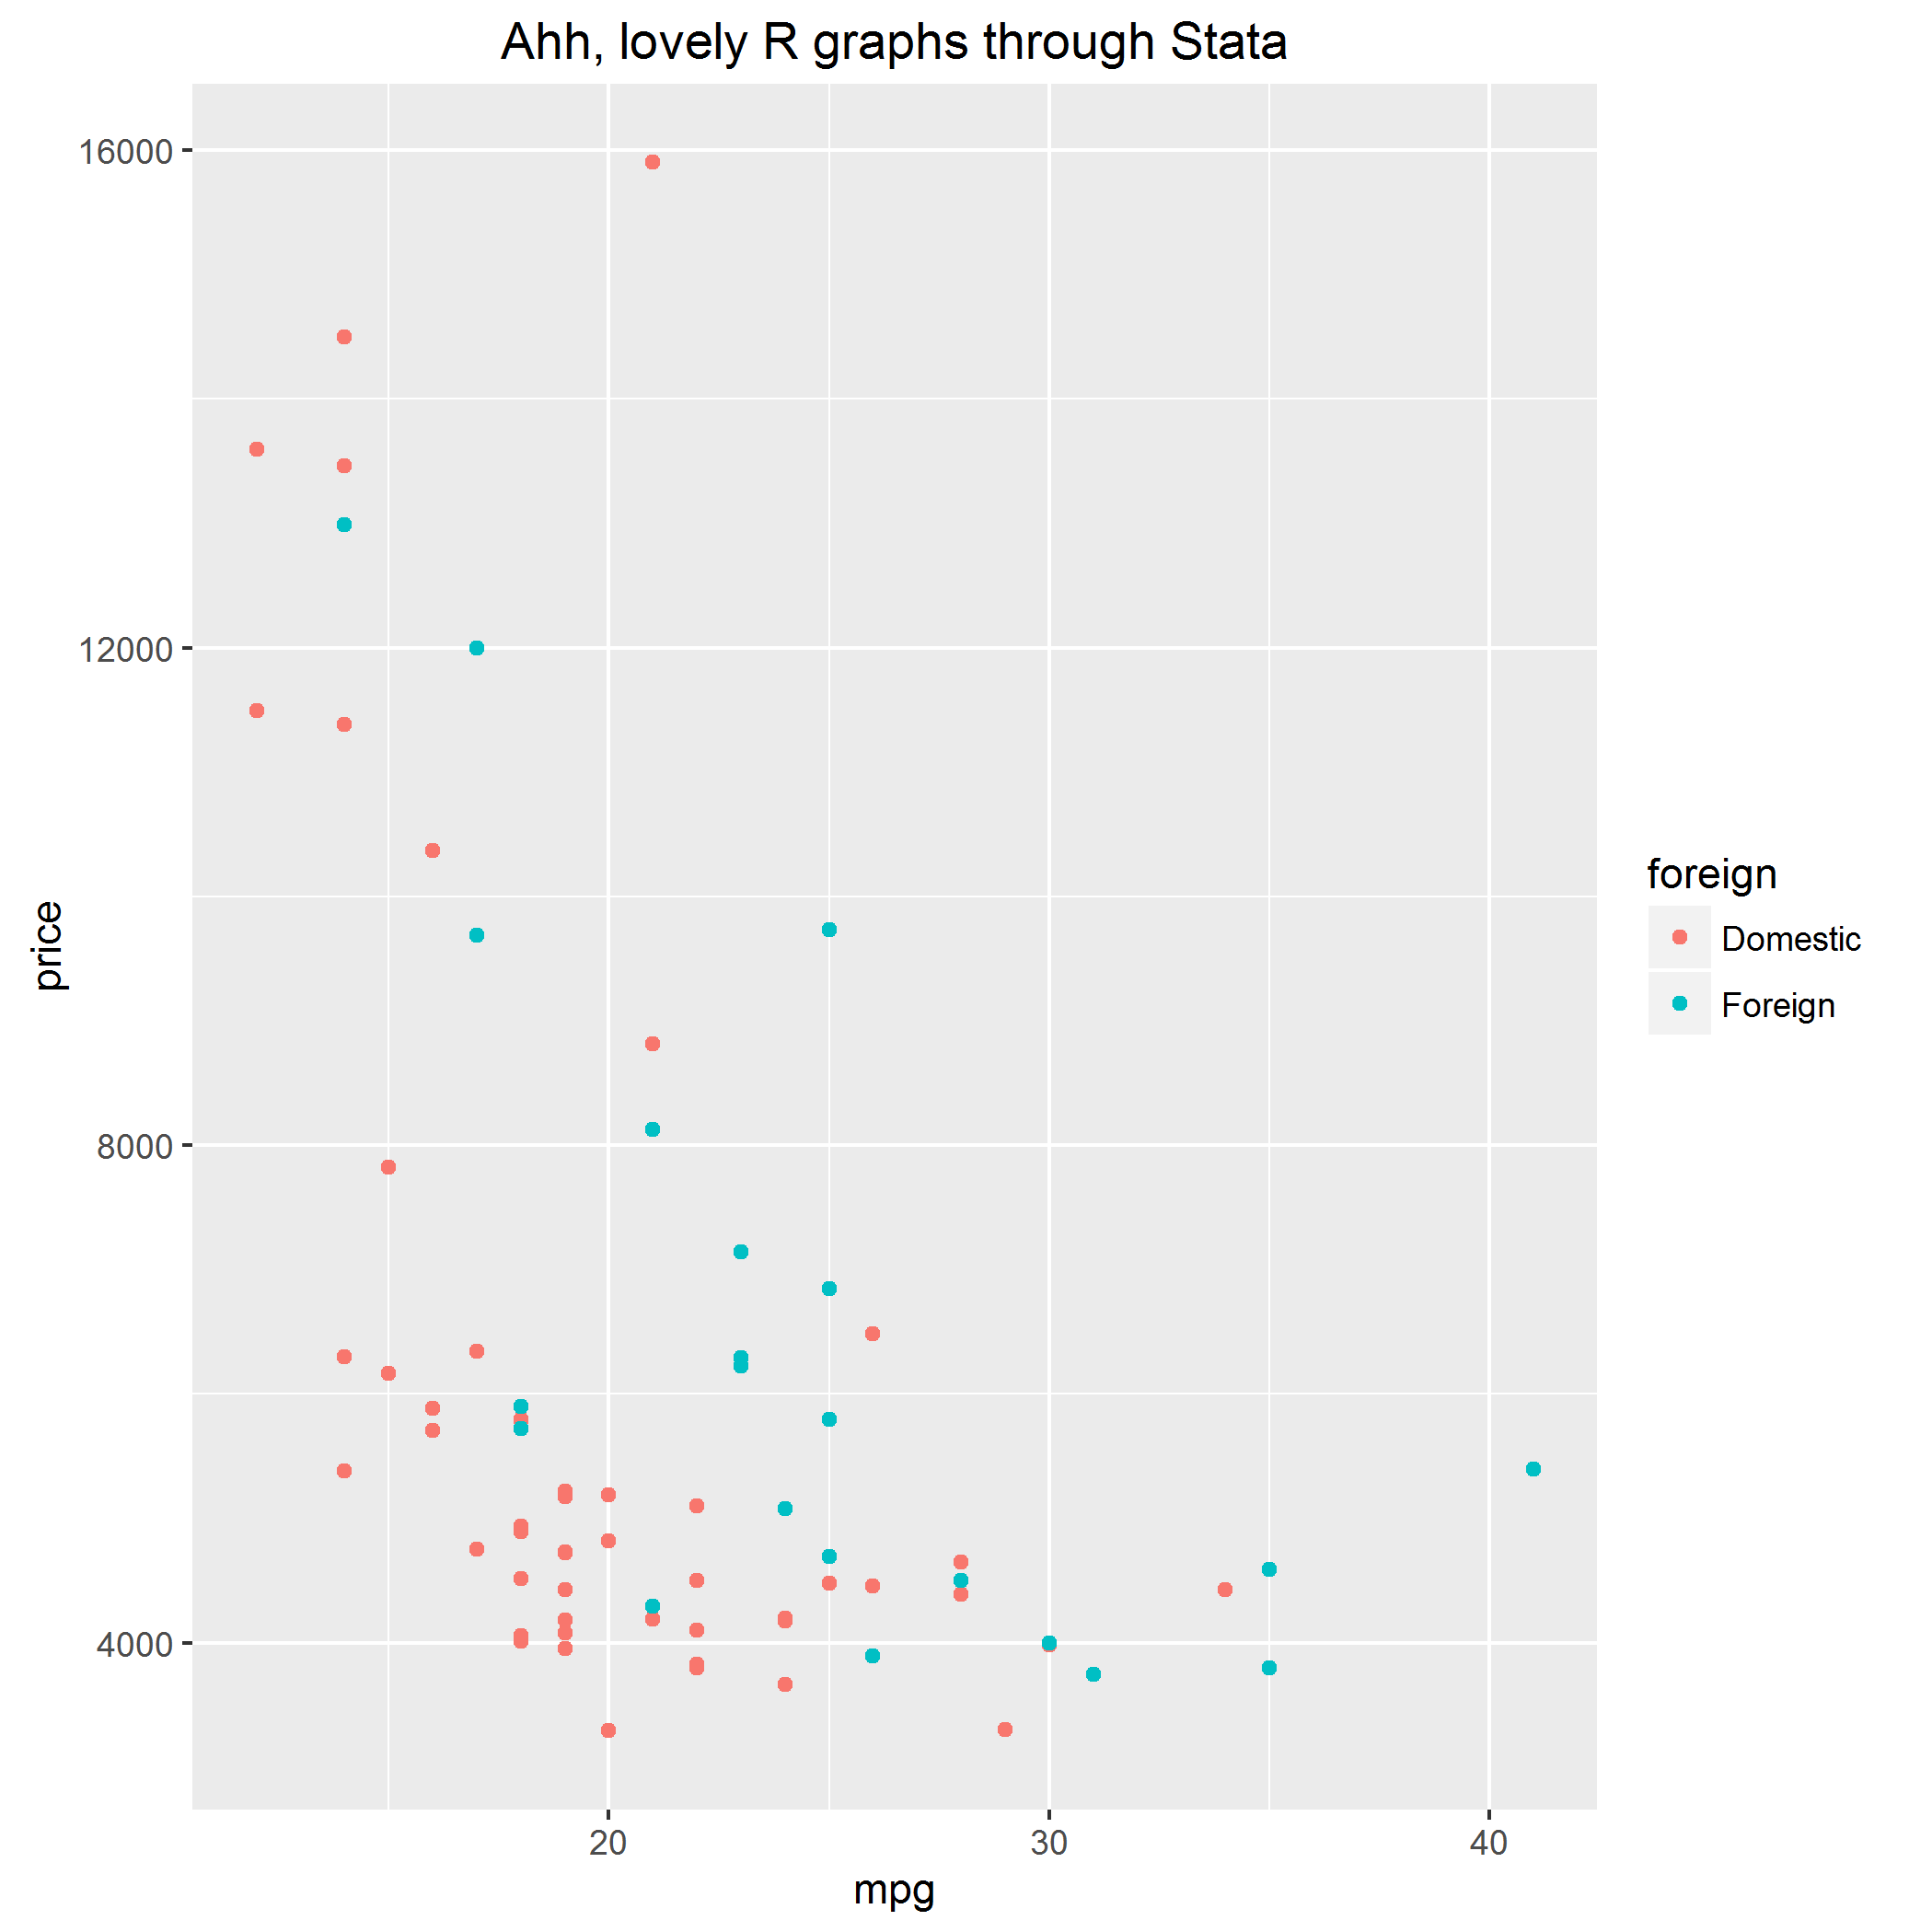
Stata is great, but it’s true that R makes prettier graphs, especially when you make use of the outstandingly excellent ggplot2 Thanks to Roger Newson we can have both. This post walks you through exploiting ggplot2 directly from Stata. I’ve tested this with both Stata 13 and Stata 14 on Windows 7 on two different computers.

Here are the steps:
- First, you need the foreign and ggplot2 packages installed in R. Install them using the install.packages() command, e.g. install.packages("ggplot2")
- Second, you need the rsource package installed in Stata. You can do this with the ssc inst rsource command.
- Third, you need to find the R terminal program, named Rterm.exe. For me, this is located in C:/Program Files/R/R-3.3.0/bin/x64/Rterm.exe. You then need to change the line in the code that begins with global Rterm_path to wherever Rterm.exe is on your computer.
Then you can use this code (click here for download). It’s well commented below so you should be able to understand what it’s doing. It produces the graph you can see above.
** Open up R interactively through Stata
** Enda Patrick Hargaden
** Boyd Center / Economics
** University of Tennessee, July 2016
** For sample purposes, let's use the auto dataset. Obviously you change this to your data.
clear
sysuse auto
***********************************************
** You need to adjust this. Find the location of Rterm.exe on your machine
***********************************************
global Rterm_path `"C:/Program Files/R/R-3.3.0/bin/x64/Rterm.exe"'
** This records Stata's present working directory in R-compatible format
local r_pwd = subinstr("`c(pwd)'","","/",.)
** Temporarily make a copy of the dataset in a format R will probably understand
saveold holderfile.dta, version(12) replace
** Start R via rsource, pass your present working directory to it
rsource, terminator("end_r_stata") roptions(`" --vanilla --args "`r_pwd'" "')
## We're now in R, so switching the comment designation from star to hash
## Stata may mention an error anytime you include an R comment. Don't worry about it.
## Use the argument (i.e. pwd) passed via Stata and move to it
stata_pwd = commandArgs(trailingOnly=TRUE);
setwd(stata_pwd[1]);
## Load the packages.
library("foreign");
library("ggplot2");
## Read and then delete the data
df = read.dta("holderfile.dta", convert.f=TRUE)
file.remove("holderfile.dta")
## Draw the graph
ggplot(df, aes(x=mpg, y=price, color=foreign)) +
geom_point() +
ggtitle("Ahh, lovely R graphs through Stata")
## Save both a PDF and PNG version
ggsave("ggplot_stata.pdf")
ggsave("ggplot_stata.png")
## And now you stop using R
end_r_stata
And there we have it. Transferring the data over to R and generating nice ggplots without ever leaving Stata. Of course you don’t need to restrict yourself to ggplots. With this basic idea you can use any of R’s capabilities directly from Stata.